Threshold Configuration
To set performance thresholds for a series of devices, you must first determine which Probe is monitoring those devices.
System performance thresholds are configurable from the container of the Probe that is monitoring the devices, or from parent containers in the hierarchy, up to the root of the container structure.
A system administrator can set system-wide thresholds at the root container of a structure. The system thresholds apply to all Probes in the container structure, and therefore to all devices in the system. A local administrator, who has access to just a few containers with just one Probe for example, can set thresholds for only the containers and the single Probe they can access. The local threshold settings apply only to the devices monitored by the local Probe.
Performance thresholds are applied hierarchically throughout a container structure. Thresholds that are defined in a parent container are inherited in sub containers. However, if thresholds have also been defined in a sub container that is a child of the parent container, the values of the thresholds set in the child container override the values of the same thresholds inherited from the parent container.
Only users with the appropriate privileges can set thresholds. See "User Permissions".
Procedure
To configure system thresholds, complete the following steps:
1. Determine which Probe is monitoring the devices you want to set thresholds for.
2. Access the Probe’s container dashboard or the dashboard of a parent container. Select Thresholds under the System Administration menu.
The Global Thresholds window displays, showing a table of all parameters with thresholds for all device types. The table lists settings that apply to the current container and all its descendant containers only. It does not display settings inherited from parent or other ancestor containers.
3. Click the icon at the intersection of the parameter and the device type to display the Thresholds.
4. Configure the parameters for the threshold:
| Parameter | Description |
|---|---|
|
Match |
Some thresholds include a configurable Match parameter. Select an option from the drop-down list for the following thresholds: Interface Availability Ports Usage RX Bandwidth Utilization TX Bandwidth Utilization |
|
Lower is Worse |
Select the checkbox if a lower value indicates worse conditions than a higher value. For example, to generate an alarm if CPU usage is less than a certain value, ensure that the Lower is Worse? checkbox is selected. The default settings assume that a higher parameter value indicates a worse condition, except for the R value used in the Voice Quality thresholds. |
|
Mount Point |
For the Disk Usage threshold, enter a text string that corresponds to an OS volume or mount point name. For example: For Windows: C:\, or E:\data For Linux and Unix: /, /root, or /data |
|
Link Download Usage |
Enter the name of the link that this threshold applies to, or leave the field blank to apply this threshold to all links. To find the name of a link, see the Link Utilization gadget on your Elfiq device dashboard. |
|
License Usage to Monitor |
License Usage threshold |
|
Name of Process to Monitor for Inactivity |
Enter the name of the process for the device: Server MX1AppServer MiContactCenter RedBoxCR OaisysCR InnlineIP MiCCEnterprise MiCCOffice MitelBD |
|
Name of Service to Monitor for Inactivity |
Choose one of the following options for the Service Inactivity threshold: Leave this field blank to raise alarms for all services being monitored by the Service Set. Enter a text string that specifies a Windows Service name. The Windows Service name is available from the Windows Service Management console. |
|
Link Upload Usage |
Enter the name of the link that this threshold applies to, or leave the field blank to apply this threshold to all links. To find the name of a link, see the Link Utilization gadget on your Elfiq device dashboard. |
|
Threshold Values |
Set threshold values by dragging the slider for the selected alarm severity or by entering the value below the slider. The slider moves to the nearest valid values for the threshold it is being set for. For instance, if the Ping Packet Loss is measured in 25% increments, the slider jumps to the nearest 25% increment. For recommended threshold values for the various device types, see "Recommended Thresholds". |
5. Click Save.
About the Global Thresholds Window
Each element in the table indicates the most severe threshold that has been configured and enabled for that combination of parameter and device type. The following table describes the threshold icons that appear in the Global Thresholds window.
| Icon | Meaning |
|---|---|
|
– |
Thresholding is not supported. |
|
|
Threshold is supported but not defined. |
|
|
Threshold is defined but not enabled. |
|
|
Most severe alarm defined for this threshold is Warning. |
|
|
Most severe alarm defined for this threshold is Minor. |
|
|
Most severe alarm defined for this threshold is Major. |
|
|
Most severe alarm defined for this threshold is Critical. |
Hovering over a threshold icon provides more details on the thresholds defined for that particular parameter and device combination.
In the following example, there is one threshold alarm configured for MiVoice Business Voice Quality.

For further information on the threshold alarms, click the icon at the intersection of the parameter and device type. The Thresholds page is displayed.

The Thresholds page shows the thresholds settings for that parameter and device pair. In this example, a minor alarm is generated when the R value is ≤ 70 and cleared when it increases to > 70 for 10 minutes.
Threshold Editing
Click the Edit button on the Thresholds page to open the Edit page.
The threshold Edit page allows you to set warning, minor, major and critical alarm severity threshold values for a specific parameter and device pair.

Time and Value Hysteresis
Mitel Performance Analytics supports both time and value hysteresis for both raising alarms and clearing alarms. This feature reduces the number of nuisance alarms.
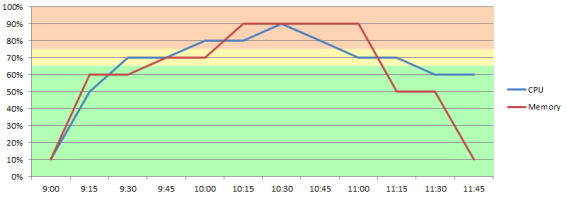
For example, in the previous graphic with standard settings for device CPU and memory utilization threshold alarms:
CPU utilization:
A minor alarm is raised at 9:45 (utilization ≥ 75% at 9:30 + 15 minutes on time requirement).
A major alarm is raised at 10:15 (utilization ≥ 85% at 10:00 + 15 minutes on time requirement).
A major is downgraded to a minor alarm 10:55 (utilization < 80% at 10:45 + 10 minutes off time requirement).
A minor alarm is cleared at 11:25 (utilization < 70% at 11:15 + 10 minutes off time).
Memory utilization
A minor alarm is raised at 10:30 (utilization ≥ 85% at 10:15 + 15 minutes on time requirement).
A minor alarm is cleared at 11:10 (utilization < 80% at 11:00 + 10 minutes off time).
The time and value hysteresis criteria are combined. In the previous example, if the memory utilization increases momentarily to 75% at 11:20, the alarm is not cleared until 11:30 (11:20 + 10 minutes off time requirement).
Examples
For example, a system administrator can set the following system thresholds for bandwidth utilization:
Raise a minor alarm when utilization ≥ 75% for longer than 20 minutes; clear the minor alarm if it drops to < 70% for longer than 10 minutes
Raise a major alarm when utilization ≥ 85% for longer than 20 minutes; clear the major alarm if it drops to < 80% for longer than 10 minutes
The previous thresholds apply to all Probes and monitored devices in the system.
A local administrator who can access a single Probe, called Probe A for example, can set the following thresholds from Probe A’s container:
Raise a minor alarm when utilization ≥ 65% for longer than 15 minutes; clear the minor alarm if it drops to < 60% for longer than 10 minutes
Raise a critical alarm when utilization ≥ 95% for longer than 10 minutes; clear the critical alarm if it drops to < 90% for longer than 15 minutes
As a result of the previous settings, Mitel Performance Analytics generates the following alarms for the devices monitored by Probe A:
Raise a minor alarm when utilization ≥ 65% for longer than 15 minutes; clear the minor alarm if it drops to < 60% for longer than 10 minutes (set locally)
Raise a major alarm when utilization ≥ 85% for longer than 20 minutes; clear the major alarm if it drops to < 80% for longer than 10 minutes (inherited from the system thresholds)
Raise a critical alarm when utilization ≥ 95% for longer than 10 minutes; clear the critical alarm if it drops to < 90% for longer than 15 minutes (set locally)